All are probably wondering where our stock market is headed, and what extraneous factors are weighing on the stock market. Possible clues can be found by examining bullish percent charts of major indices, which can help find major inflection points.
Compare the charts of the Bullish percent index of the S&P 500 and the S&P 500 Index which are respectively listed.
I'll provide some thoughts down below.
Compare the charts of the Bullish percent index of the S&P 500 and the S&P 500 Index which are respectively listed.
I'll provide some thoughts down below.
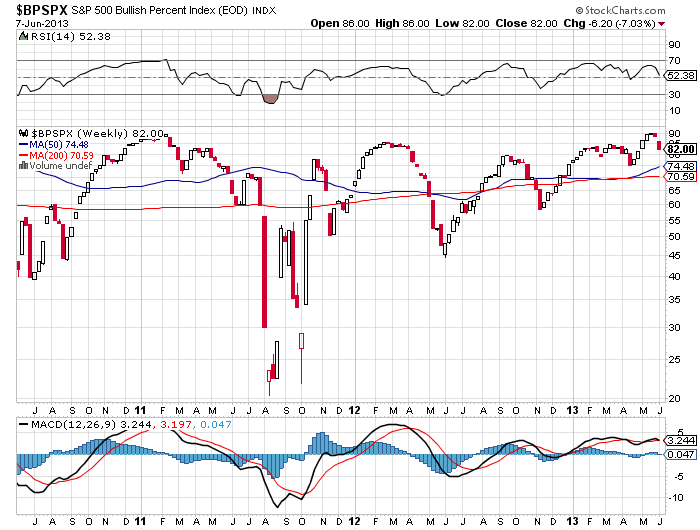
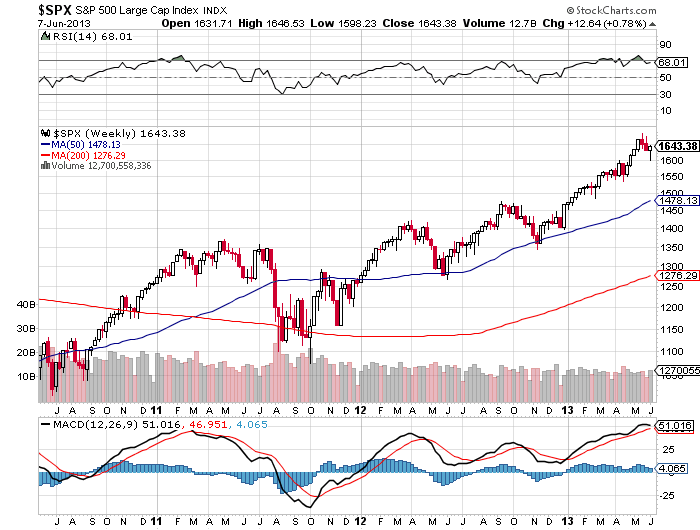
Let's reflect upon what these charts are telling us. In the past 3 years, the S&P 500 Bullish percent index told us the best time to buy was approximately in August 2011 when it hit 25, which is pretty darn good information as that was the approximate time in which you could have bought the index and had limited time (if any) in which your trade would be losing. A moderately good signal was also shown in July 2010 and June 2012 where the bullish percent was hovering around 45, and those times have proven to be a good time to buy in the stock market.
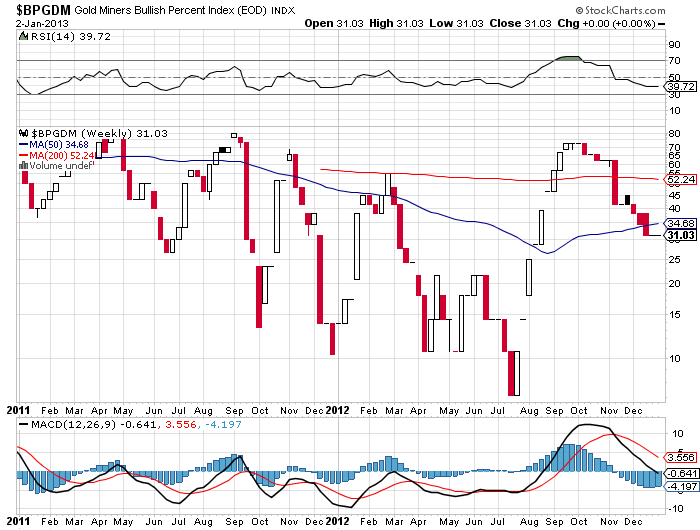
Now, please examine some charts of the Gold Miners, which has been a market full of bearish sentiment lately. The second chart provides a cleaner view of the full year bullish percent for 2011 and 2012.
Now, please examine some charts of the Gold Miners, which has been a market full of bearish sentiment lately. The second chart provides a cleaner view of the full year bullish percent for 2011 and 2012.
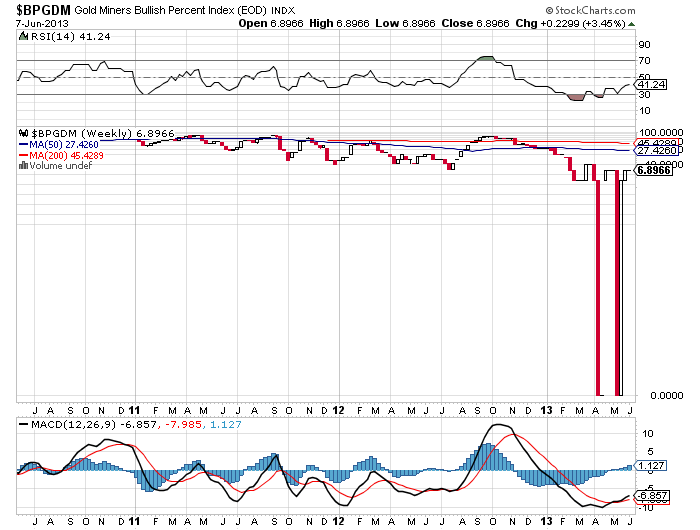
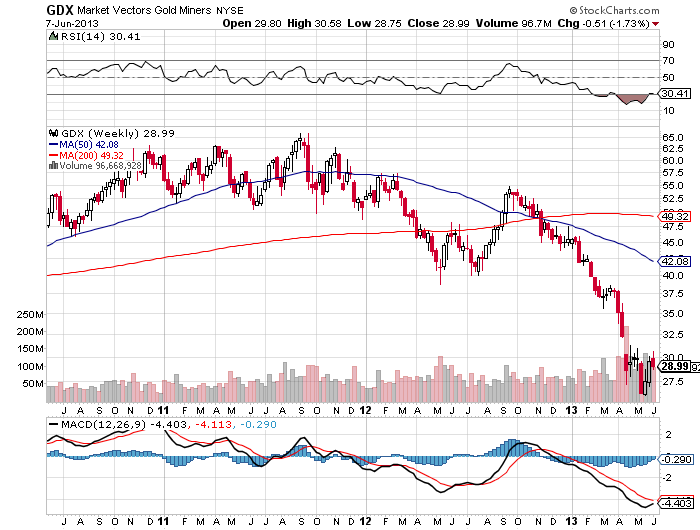
Now, here is a market that has been rather full of bearish sentiment has of late. What I see that is particularly notable from this chart is that those who bought GDX around September 2011 must be kicking themselves as they paid around $63/share when GDX's bullish percent index was around 75 for an investment that is now worth about $29/share.
Heck, the weekly MACD indicator is also almost crossing over and relative strength is now just over 30. This shows that Gold Miners definitely have some room to run on the upside.
This shows me that the lows being made in gold now are much like the lows made in the broader stock market in late 2008 and early 2009. When the stock market hit those major lows, the bullish percent indicator was 10 and 17 respectively in those months.

 RSS Feed
